Data Loading Troubleshooting#
Profile: Project Creator
This page lists common issues that may arise when loading data into Squirro with troubleshooting steps to resolve them.
It is primarily intended for Squirro project creators who load data via the Squirro UI.
Reference: Learn more about the UI Data Loader.
Where to Troubleshoot Issues#
There are several places you can look for data loading issues and troubleshooting that it’s helpful to be familiar with, including the following:
The Data Sources Page in the Squirro UI
The Data Ingestion Logs Dashboard in the Squirro Monitoring Project
The Pipeline Workflow of the Data Source
The Explore tab of the Setup space.
See below for instructions on how to access each of these places:
Data Sources#
The first place to look for issues with your data loading is the Data Sources page in the Squirro UI.
To access the Data Sources page, follow the steps below:
Log in to your Squirro project.
Navigate to the Setup space.
Click Data Sources in the left navigation bar.
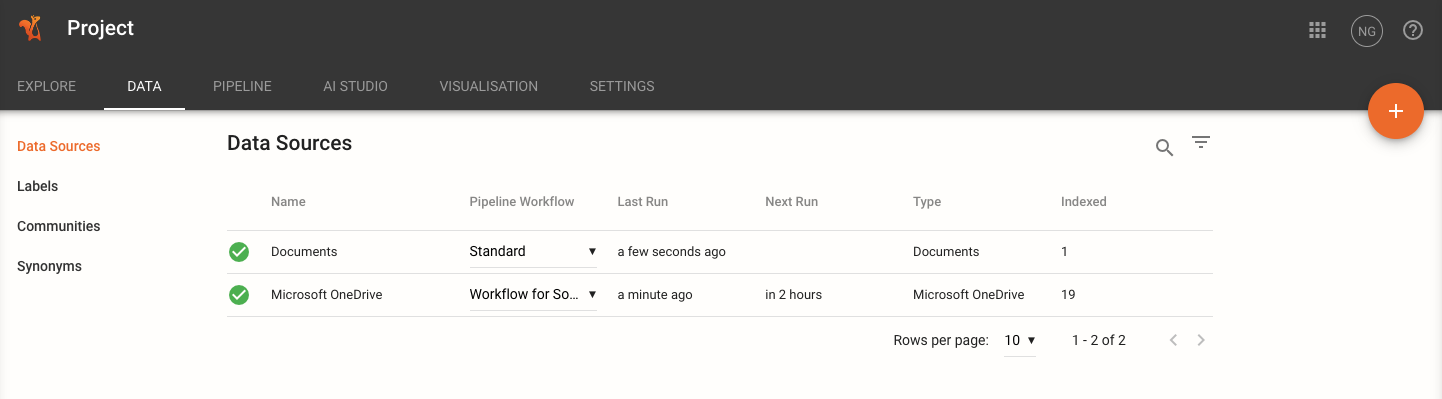
Once on the page, you’ll see a list of all the data sources in your project and their status.
You can also add additional data sources by clicking the orange plus icon in the top-right corner of the page.
Data Ingestion Logs#
Every Squirro server has a Squirro Monitoring project installed by default that contains a Data Ingestion Logs dashboard.
To access this dashboard, follow the steps below:
Log in to your Squirro project.
Click the Spaces menu (the grid icon in the top-right of the page) and click Squirro Monitoring.
Click the Data Ingestion Logs tab at top.
Reference: Learn more about the Squirro Monitoring.
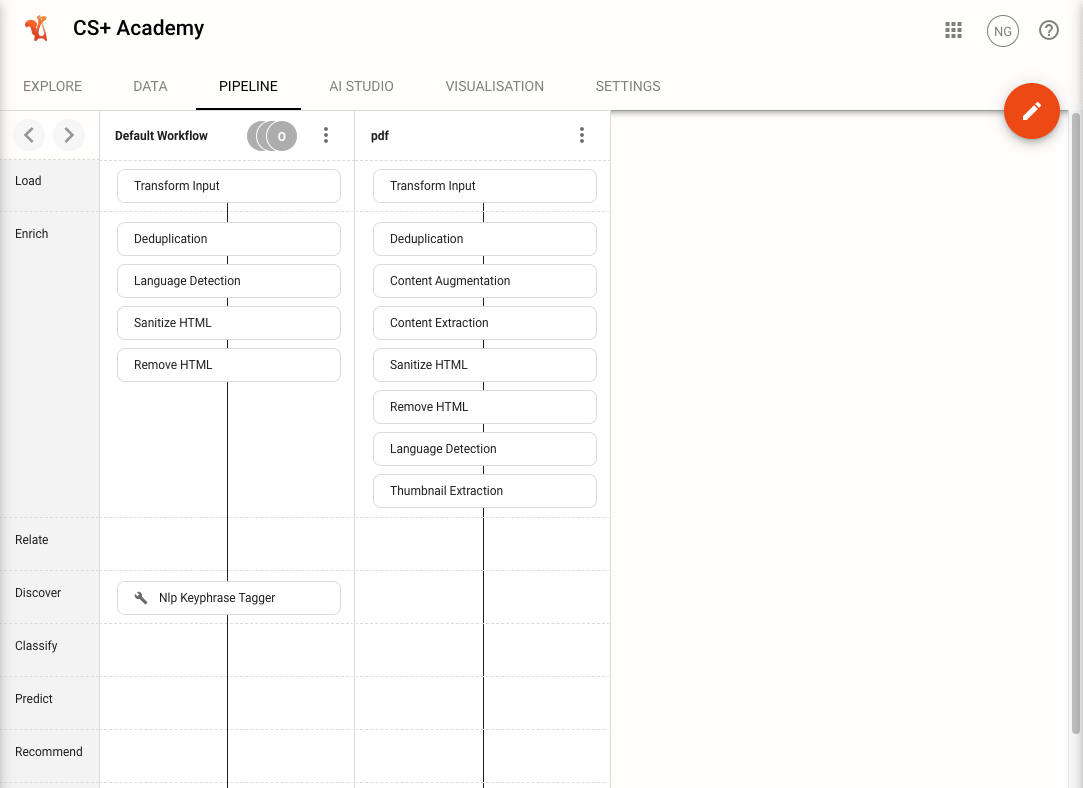
Pipeline Workflow#
The Pipeline Workflow of a data source is the series of steps that Squirro takes to ingest data from a third-party system and index it into Squirro.
Squirro allows you to customize the Pipeline Workflow of a data source to suit your needs, or run multiple pipeline workflows if you have different needs for different data sources.
To access the Pipeline Workflow of a data source, follow the steps below:
Log in to your Squirro project.
Navigate to the Setup space.
Click the Pipeline tab.
Reference: Learn more about the Data Processing Pipeline.
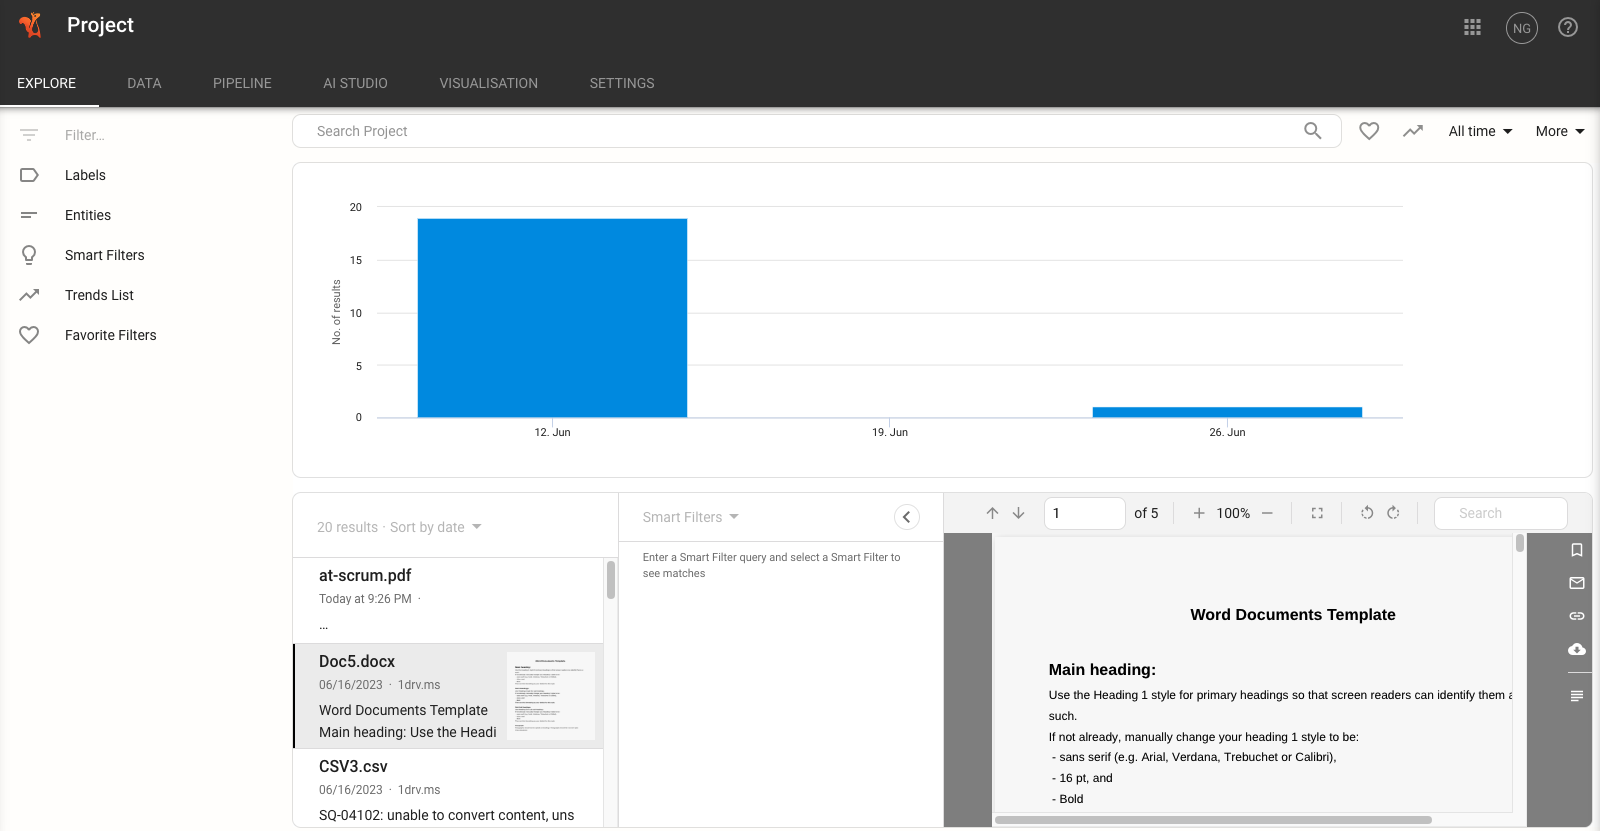
(Setup) Explore Tab#
Navigating to Setup > Explore will show you the data that has been ingested into Squirro.
This page is useful for troubleshooting data loading issues because it shows you the data that has been ingested into Squirro and allows you to search for specific data.
You can also scroll through and click different file types to preview how they have been ingested by Squirro, which can help troubleshoot issues with specific file types.
General Troubleshooting Workflow#
If you are experiencing issues loading data into Squirro, the following steps provide a general workflow for troubleshooting data-loading issues:
1 - Check Data Sources Logs#
To check data source logs, navigate to Setup > Data to check the logs of the data source you are trying to ingest data from.
You can access the logs by clicking the three-dot menu associated with a particular data source and clicking Logs.
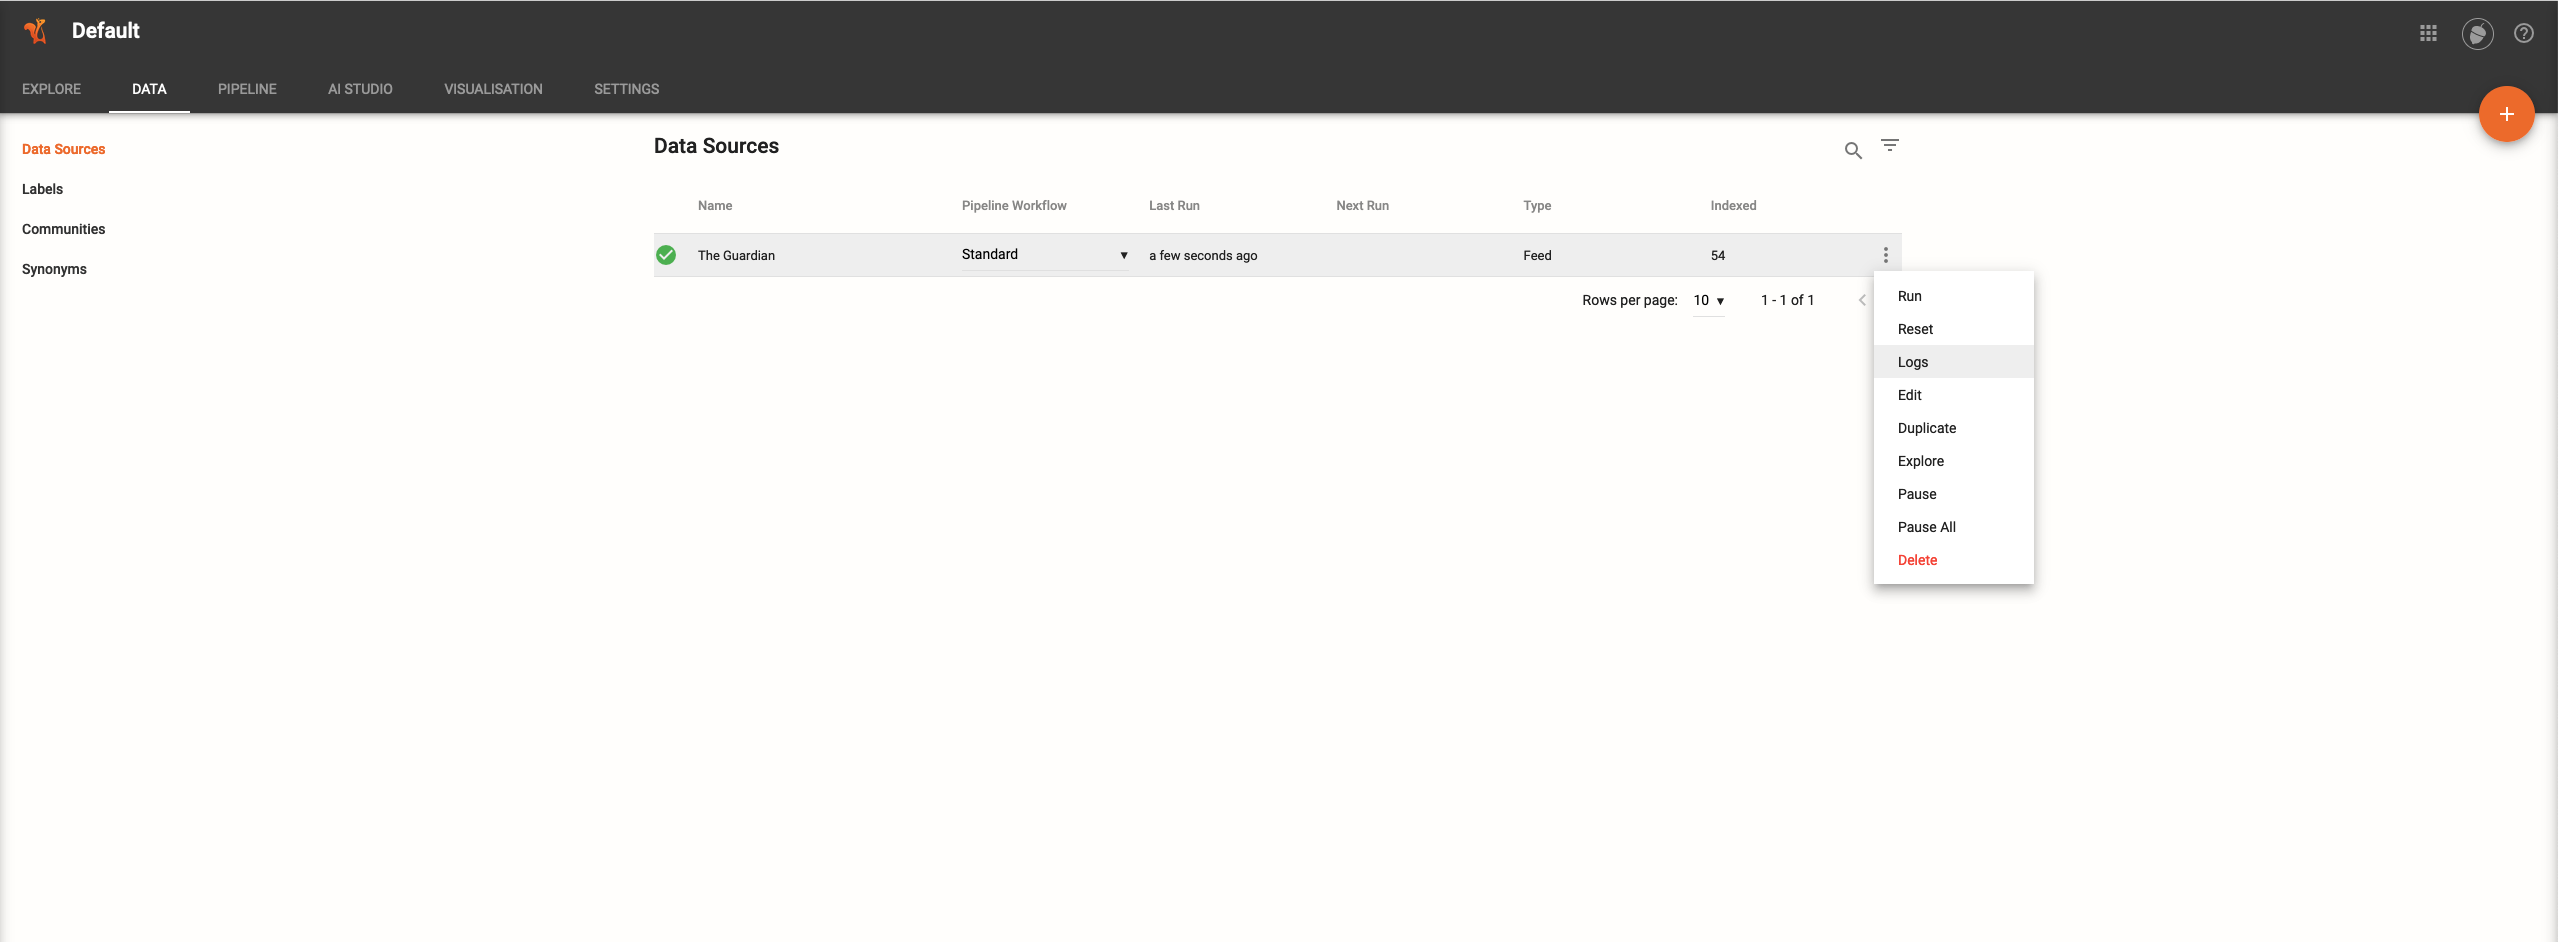
In the following example, the RSS Feed data loader plugin was used to create a new data source called The Guardian.
In the screenshot below, you can see that 54 rows were loaded to Squirro:
Note: Each row ingested by Squirro is transformed into a Squirro Item. Learn more about Item Format.
The data loader plugin for RSS feeds was used (shown in the UI as the RSS Data Connector) and extracted those items from the third-party source (the RSS Feed of The Guardian) and brought them into Squirro.
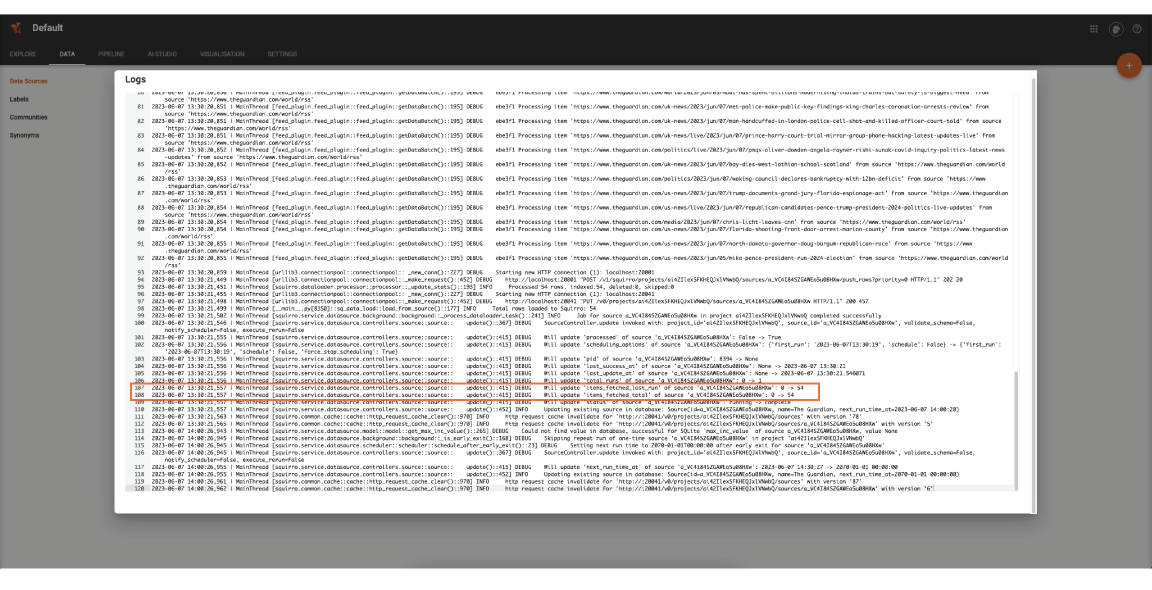
Understanding the Logs#
These rows are now in the /var/lib/squirro/inputstream directory, which is accessible by anyone with ssh access to the server (e.g. the server administrator).
This is what the above log shows us: that the data loader extracted 54 rows, no errors occurred, and the data represented by those rows was ingested into Squirro to transform that data into Squirro items and apply the transformations included in the Pipeline Workflow of the source and eventually index them into Squirro in order to make them searchable.
If something goes wrong with the extraction of the data from the data loader (e.g., a timeout error when the data loader plugin tried to connect to the third-party service), an error message will appear here.
2- Transformation and Indexing#
The second part of the data ingestion process starts from the /var/lib/squirro/inputstream directory.
Here the processors of the ingester service pick up the rows from inputstream service (they are contained in files called batches) and apply the pipeline steps of the pipeline workflow that the source of this batch is configured to.
To debug issues occurring at this stage there two options, you can either:
Check Squirro Monitoring
Check the logs on the server
Squirro Monitoring is more for high-level investigations of data loading issues than checking logs on the server. If a pipelet fails, for example, you’ll need SSH access to view the stack trace for detailed troubleshooting.
Note
The amount of data shown in logs depends on whether their LEVEL is set INFO or DEBUG. The following section explains this distinction.
Structured Logger vs Default Logger#
To see all the log messages that can appear in this dashboard, you need to get into the server and configure level = DEBUG for the logger of the ingester service.
For performance reasons, the default level of each service is INFO, which presents a high level overview including warnings and errors.
If you want to see all of the logs for debugging purposes, you need to change it to DEBUG. To do so, follow the steps below:
Log in to the server via SSH.
Open the INI file of the service you want to change the logger level for in any text editor.
Change the logger level from
INFOtoDEBUG.
If you cannot find the level option in the INI file, then add a section as follows:
[logger_root]
level = DEBUG
Reference: Squirro Services are Python based, to learn more about logging levels, see Logging Facility for Python.
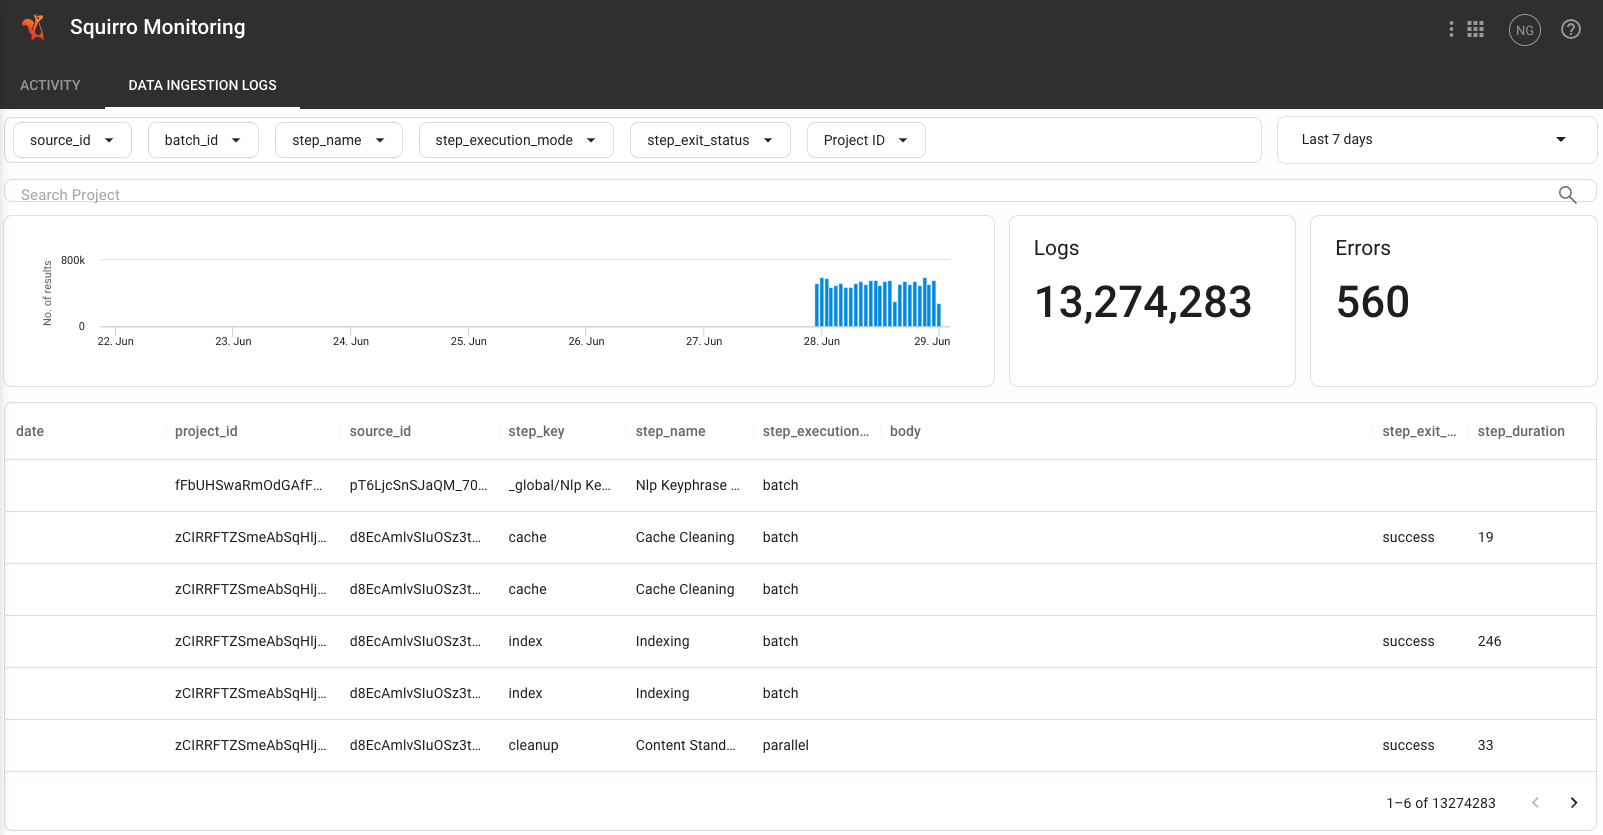
Check Squirro Monitoring#
You can use the Data Ingestion Logs dashboard within your instance’s Squirro Monitoring project to view data loading issues.
There you can choose the Project ID or Source ID you want to see logs for.
Using the Project Id gives you a high-level overview of all the sources in the project, and the status of the last ingestion of each source.
Using the Source Id gives you a more detailed view of the last ingestion of that source, and also allows you to drill down and view the status of each step of the pipeline workflow.
Tip: Use the Explore page to find the source id for the data you care about.
If an error occurred in one of the steps, you should see it listed, or at least that the exit status of the step is error.
Note
By default, only error logs appear. So successful ingestions of data won’t show anything in this dashboard.
Check the Logs on the Server#
If Squirro Monitoring doesn’t provide sufficient troubleshooting detail, the second option is to check the logs of the ingester’s processors on the server.
This method provides more information, but it requires ssh access to the server and some familiarity with the Linux system.
It is more suitable for system administrators or other advanced users with server access.
Reference: To learn more about available logs, see Monitoring.
For example, to check the logs of the topic service, you can use the following command:
tail -f /var/log/squirro/topic.log
Tip
This will show live results. If you want to see the whole file, use cat or less (or tool of your choice) instead of tail.
Data Indexing Issues#
The following are potential data indexing issues that may arise when loading data into Squirro.
Zero Files Ingested#
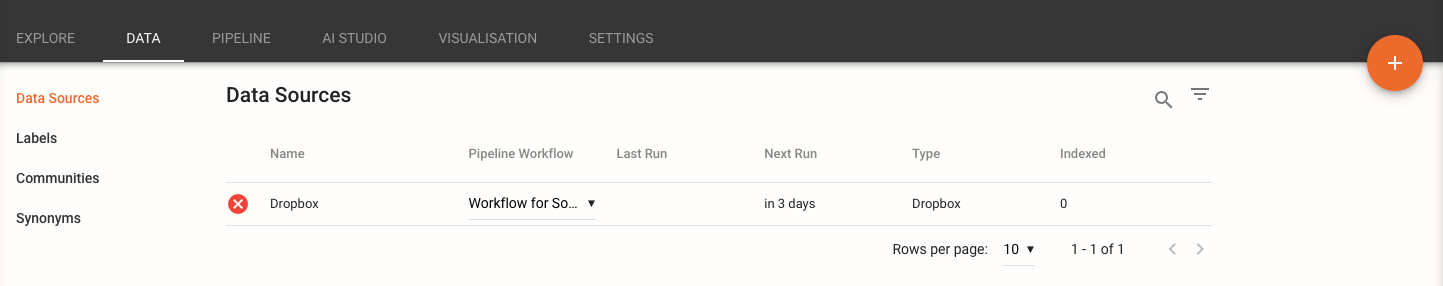
If zero files have been ingested into Squirro, this is likely because the data source has not been configured properly.
Potential issues include:
Connector Configuration Errors: Check your configuration settings for your connector to ensure that they are correct. Check folder paths and verify that third-party apps are authenticated correctly.
Wrong Pipeline Workflow Selected: If the documents you are ingesting rely on a custom pipelet or non-default pipeline step for ingestion, check the pipeline workflow you’ve chosen to ensure it is appropriate.
Server Overload: If the server is overloaded, it may not be able to ingest data. Check the status of the inputstream (via SSH).
There are several reasons why data may not index properly into Squirro, from corrupted documents to unsupported file formats to using the wrong pipeline workflow to ingest data.
The following scenarios detail some of the most common issues that may arise when loading data into Squirro and how to resolve them.
Some Files Are Ingested but Not All#
If you see that some files have been ingested into Squirro but not all, this is likely because the files that were not ingested are not supported by Squirro or have some other issue that is preventing them from being ingested.
Potential issues include:
Password-Protected Files: Squirro cannot ingest password protected files. They will be skipped during the ingestion process and will not show as errors. If you have password protected files that you want to ingest into Squirro, you will need to remove the password protection before ingesting them.
Unsupported Formats: For a list of supported file formats, see Searchable File Types. If the format is not supported, it may either be skipped or fail to ingest properly.
Improper Connector Configuration: If you are using a third-party connector to ingest data, you may have misconfigured the connector. Check the connector configuration to ensure that it is correct, particularly if you have specified specific folders to ingest. Squirro offers documentation for most connectors, see Data Connectors.
Necessary Plugin is Disabled: If a necessary data-loading plugin is disable at the server level, this may create issues ingesting data.
Cannot Find Data#
The following are potential situations where you cannot locate data you’ve previously ingested into Squirro.
Project Data Disappeared After Removing Data Source#
If you remove a project data source from the Data Sources page, all the data that was ingested from that data source will be removed from the project.
This is the case even if you only set the data source to ingest once, manually, or have other data sources that are still ingesting data into the project.
You must re-add the data source to the project and re-ingest the data to get it back.
If you have lost data that you need to recover, contact Squirro Support.
Files Deleted By Other Project Members or Administrators#
If you are unable to find data that you know was ingested into Squirro, it may be because another project member or administrator has deleted it.
Reference: To learn more about which users have access to a project’s Setup space, see Squirro Roles & Permissions.
Squirro Support#
If you are unable to resolve your issue using the information in this guide, you can post a question in the Squirro Forum or contact the friendly folks at Squirro Support.