Getting Started#
Squirro is an enterprise generative AI platform that helps organizations extract value from large volumes of structured and unstructured data. The platform combines enterprise search, conversational AI, data classification, and automation in a single solution. Following the acquisition of Synaptica in 2024, Squirro also offers knowledge graph management capabilities, allowing organizations to strengthen data categorization with taxonomies and ontologies.
Products#
Squirro, the company behind the trusted AI solutions used by major financial services worldwide, offers two powerful products.
An enterprise-grade generative AI solution that unifies enterprise search, conversational AI, data classification, and automation into a single platform.
Knowledge management software for creating and managing taxonomies, ontologies, and other Knowledge Organization Systems to strengthen data categorization.
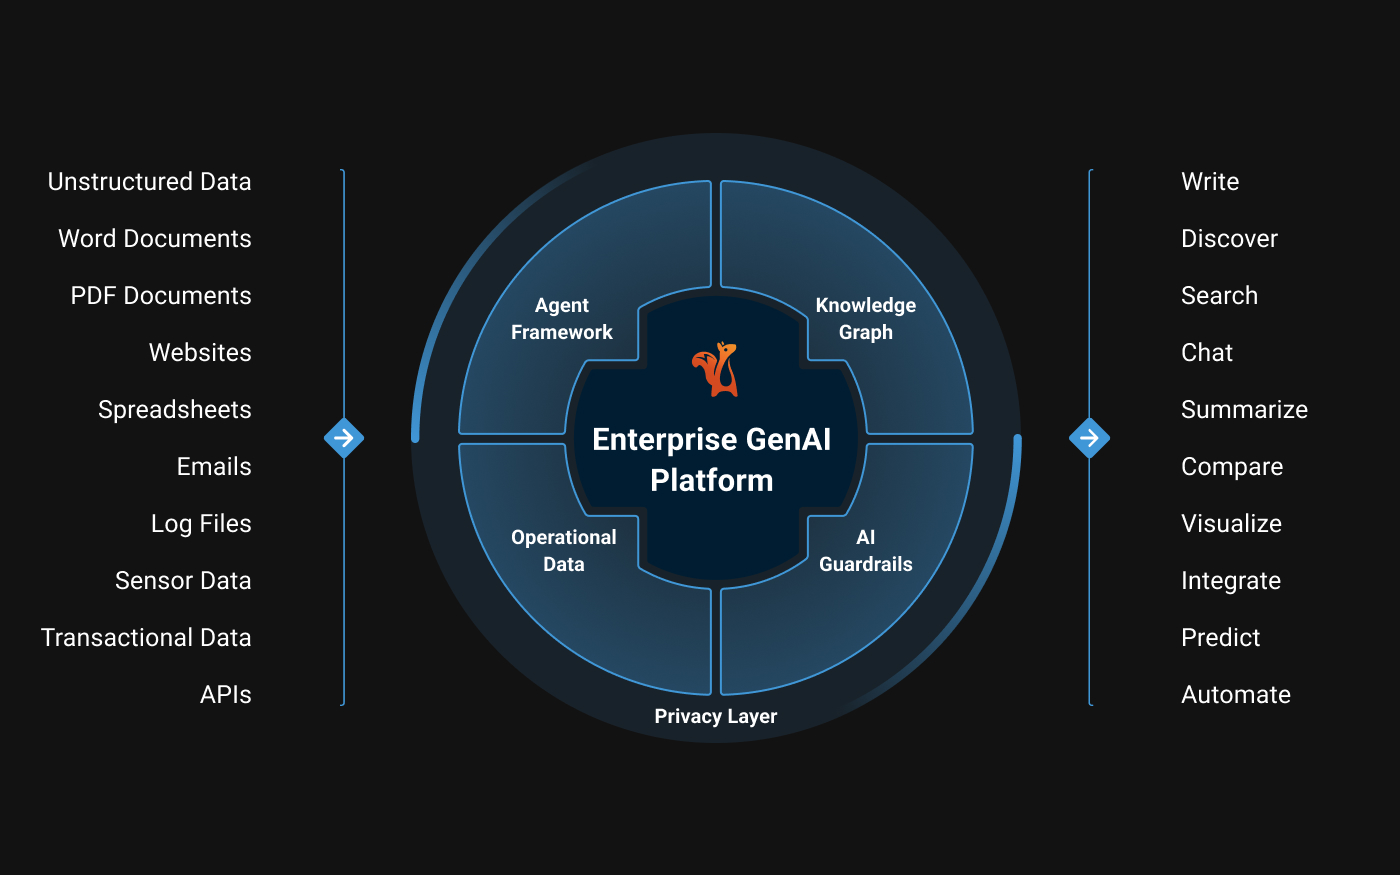
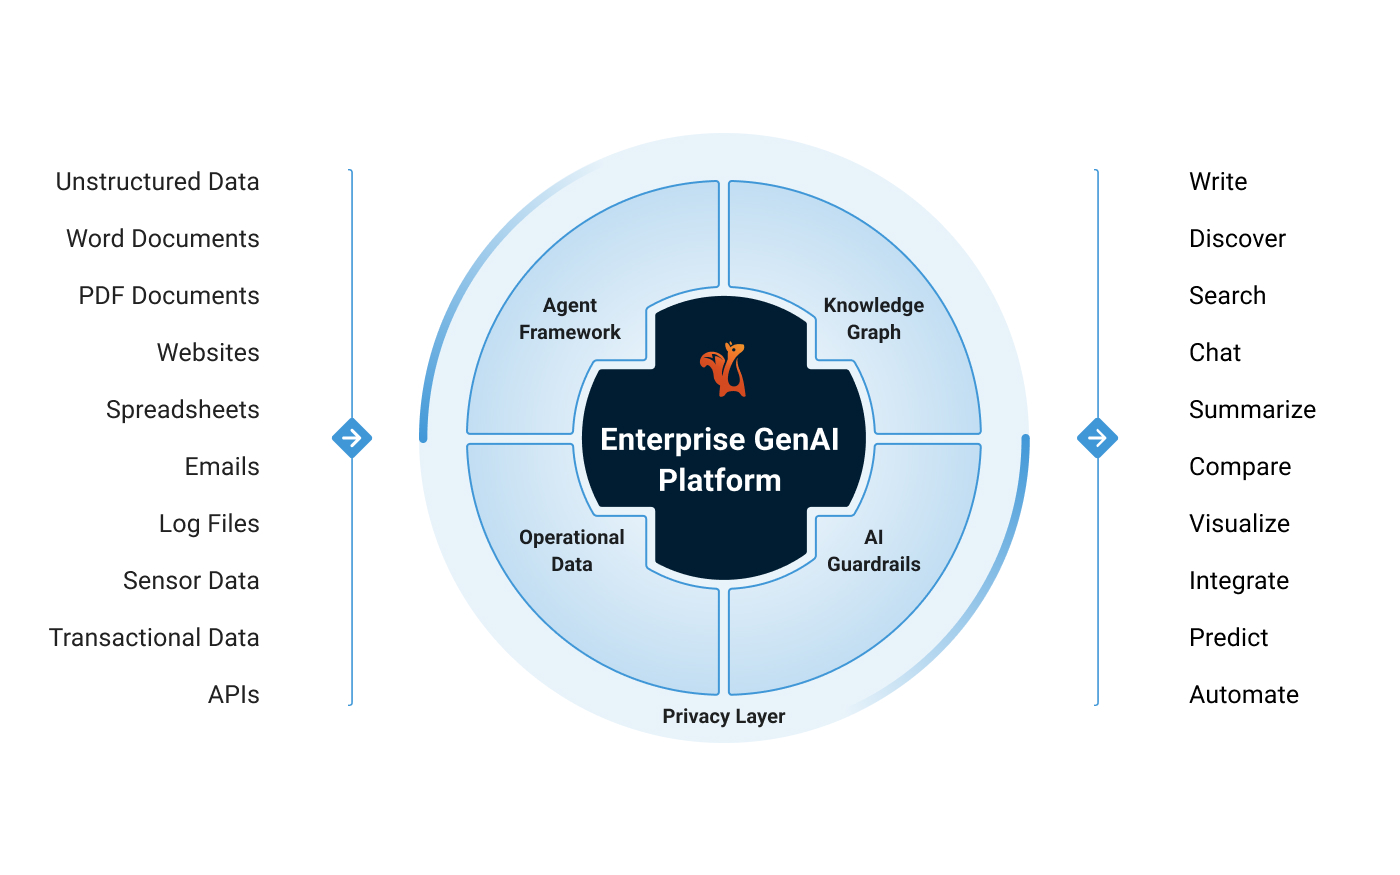
Enterprise GenAI Platform#
The Squirro Enterprise GenAI Platform serves as an enterprise-grade generative AI solution, specifically engineered to enable organizations to unlock the full value residing within their data assets. The platform creates an efficient and unified knowledge base by seamlessly integrating and contextualizing diverse structured and unstructured data sources. This foundation powers advanced AI-driven features, including modern enterprise search, responsive conversational AI interfaces, automated data categorization, and robust classification capabilities to organize and leverage information effectively.
Deploy Squirro#
Squirro offers various methods to install and host the platform, each offering a unique set of benefits suited to different use cases and user needs, allowing you to choose the approach that best fits your business requirements.
Squirro as a Service#
The Squirro Self-Service platform allows users to create and manage their own Squirro installations and projects.
Ansible Automation Platform#
The recommended approach is to use the Ansible plugin, which offers idempotent, reproducible, customizable, and faster installation options compared to manual installations.
Squirro Containers#
The Squirro Minimal Container Image is a lightweight container for testing, development, and minimal production deployments.
Manual Installation#
A comprehensive guide to installing Squirro on a Linux system. It covers the recommended approach, architecture overview, prerequisites, and detailed installation steps for storage and cluster nodes.
Connecting Data Sources#
Squirro leverages advanced search technologies as part of its broader capabilities, enabling efficient information retrieval and management across diverse data sources.
Processing Data#
The Squirro data processing and classification system follows a structured sequence called the Pipeline, where connected data undergoes multiple transformation stages to become enriched, categorized, and actionable. Using AI Studio, users can create, train, and deploy machine learning models without requiring extensive coding knowledge.
Visualizing Data#
Squirro data visualizations help you understand and gain insights from your data through customizable dashboards. These dashboards, pre-configured in applications, can be extended or created from scratch using a drag-and-drop editor.
Communities#
Communities in Squirro allow users to personalize their experience by following topics of interest, grouped into Community Types defined by the project creator. Users can identify subject areas of interest and receive tailored, relevant content.
Search#
Squirro Search is an advanced AI and Machine Learning (ML) powered solution designed to address the limitations of traditional enterprise search by providing more relevant, intuitive, and personalized search results. Unlike conventional search methods that rely solely on keyword matching, Squirro Search combines semantic search with keyword search to understand user intent and interpret data.
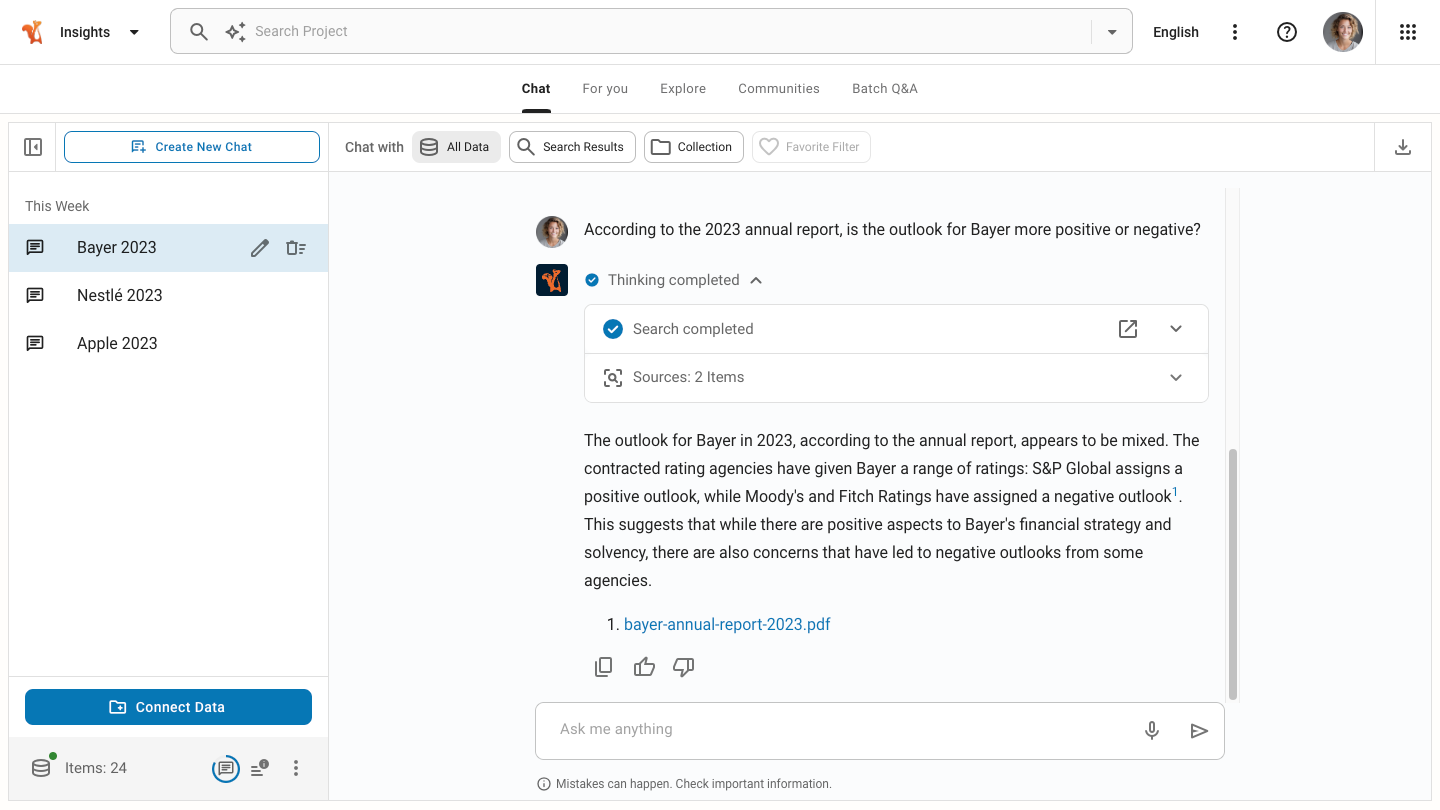
Chat#
Squirro Chat is an enterprise-ready generative AI application for organizations that want a natural language tool to interact conversationally with their data. It operates as a secure digital assistant, allowing users to chat with organizational data or website content through an embedded interface, providing sources for its answers to ensure context and understanding.
Synaptica#
Synaptica is knowledge management software, available as a standalone product or integrated as part of a Squirro solution, designed to reinforce data categorization and classification by creating and managing Knowledge Organization Systems (KOS).
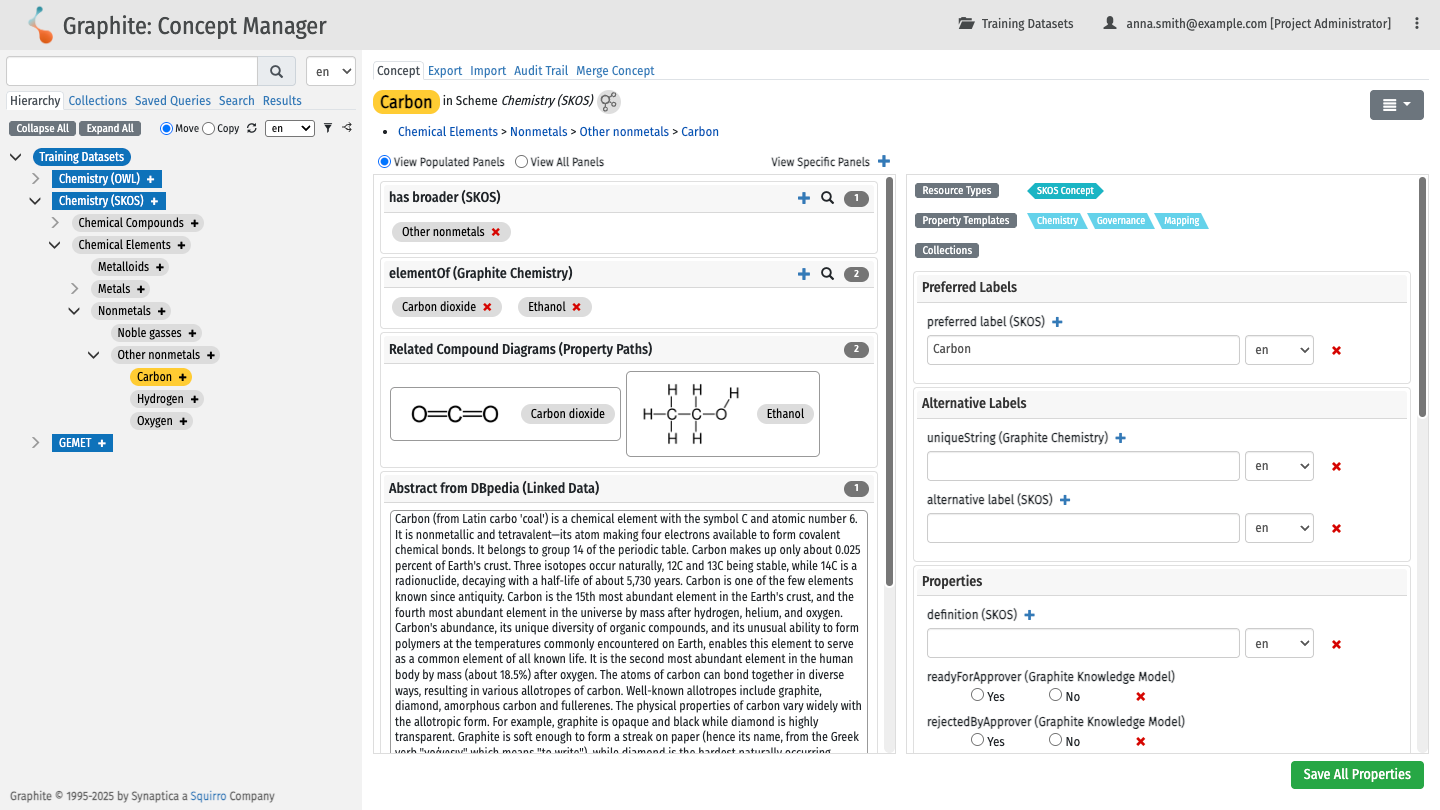
It uses an intuitive interface to leverage semantic web standards and RDF graph databases to structure taxonomies, thesauri, and other KOS types. This robust management of enterprise terminologies massively increases the accuracy and efficiency of applications, particularly enhancing enterprise-grade conversational AI experiences.
Security#
As an ISO 27001-certified organization, Squirro is fundamentally grounded in a strong emphasis on security, ensuring that client data protection is at the core of its operations. Squirro is deeply committed to maintaining the highest standards of security and privacy.