Squirro Monitoring#
This page describes the Squirro Monitoring space, which allows you to monitor user and data ingestion activity throughout your Squirro instance.
By default, a Squirro Monitoring project is automatically installed on new Squirro instances.
Important: Squirro Monitoring covers an entire instance, not an individual project. All projects on an instance share the same Squirro Monitoring.
Accessing Squirro Monitoring#
Squirro Monitoring is accessed through the Spaces menu once you’ve logged into a project.
Relevant User Profiles#
Squirro Monitoring provides valuable insights to two groups of people.
The first group includes anyone wanting to understand user activity trends within a project. Typically, this is the project creator.
The second group includes anyone wanting to understand data ingestion activity within a project. This is often the project creator, but can also include model creators and data scientists connecting data sources to the Squirro platform.
Using Squirro Monitoring#
Two dashboards are available within Squirro Monitoring:
Activity
Data Ingestion Logs
Both dashboards will show historical project data for a specific time period by default.
Note: You can change the active time interval by using the time selection widget in the dropdown menu.
Note
You can add or modify Squirro Monitoring widgets using the Dashboard Editor.
Activity Dashboard#
The Activity dashboard displays user activity within the project. This is where you can identify usage trends within the Squirro platform and your project documents (items).
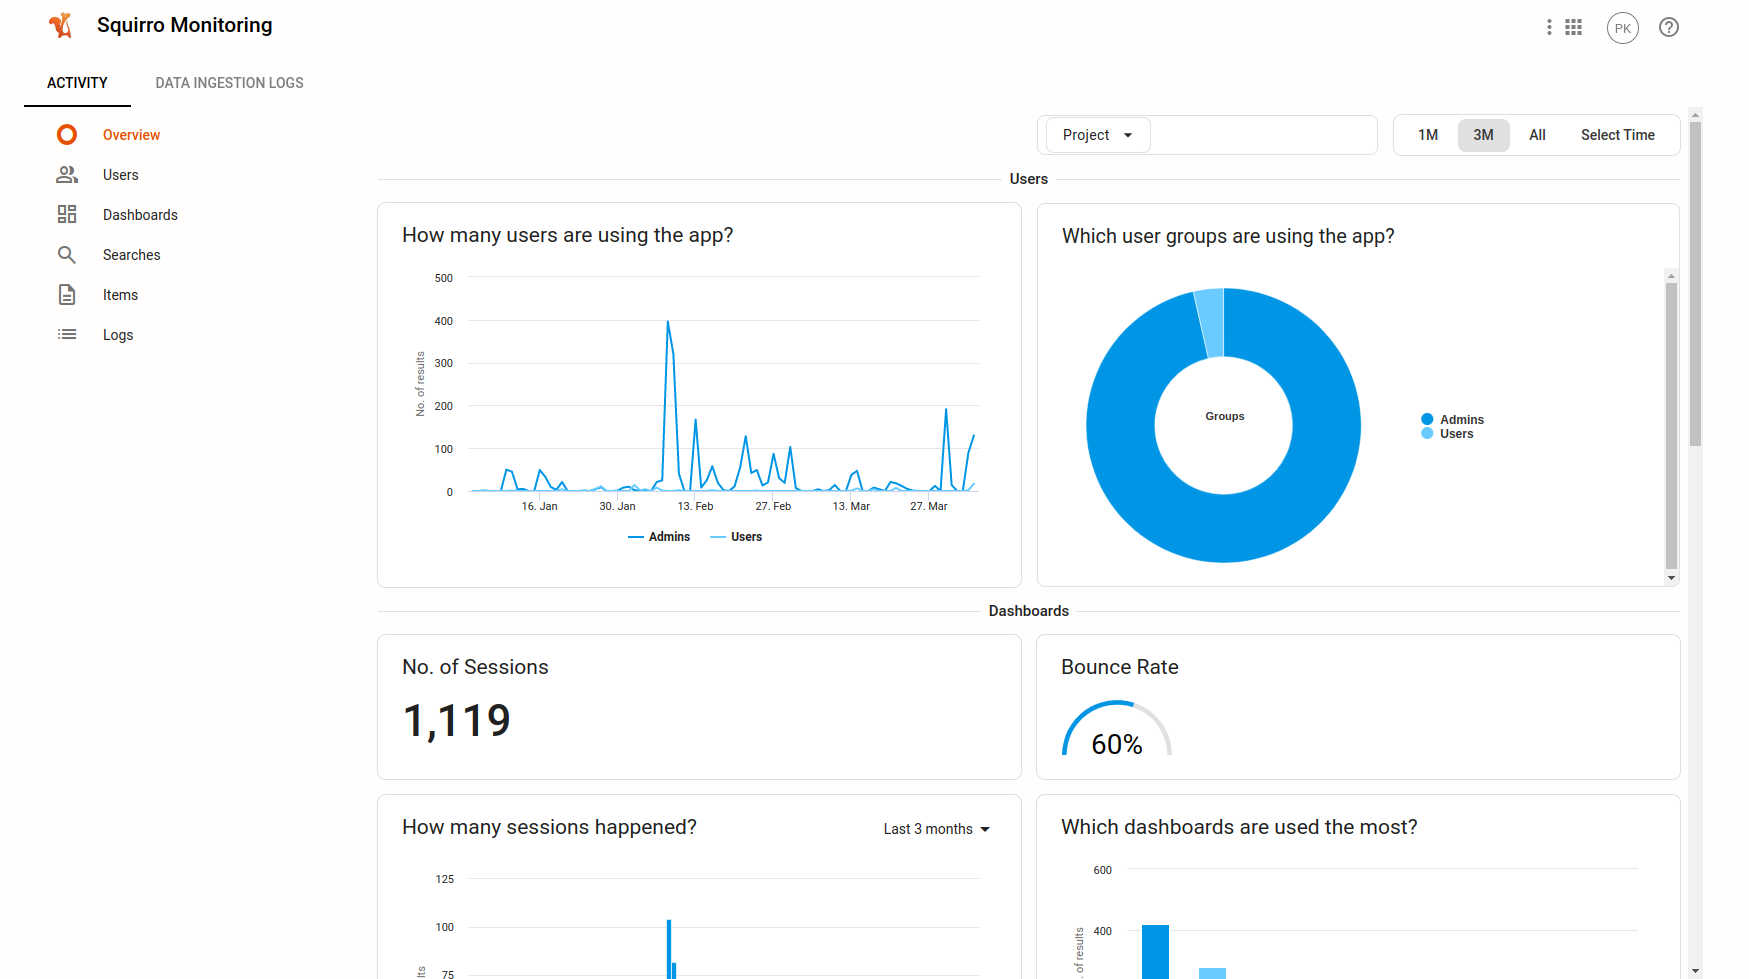
The following is an example Activity Dashboard:
Important
The menu at top allows you to filter results by project and timeline. By default, all projects within the instance with the 3 months active time interval are shown.
You can use this dashboard to identify:
Which dashboards project users are using most frequently
Dashboard usage trends over time
Which groups are the most active
Search trends within groups
The total number of items opened and trends in item utilization over time
Reference: If you are looking for further information about tracking user behavior within Squirro, see Activity Tracking.
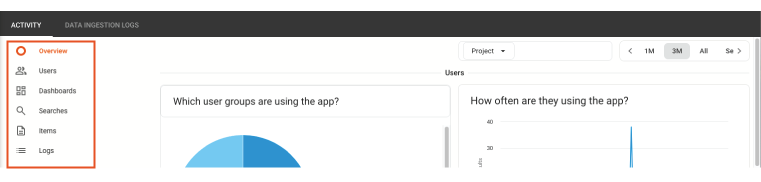
There are four types of widgets found in the default Squirro Monitoring Activity dashboard: Users, Dashboards, Searches, and Items. The most popular widgets from each category are included in the Overview section. They are categorized below by the type of information they provide and align with the links in the left navigation bar within Squirro Monitoring.
Note
You can add or modify Squirro Monitoring widgets using the Dashboard Editor.
Users#
No. of Users: Shows the total number of users with unique IDs that have logged into the project. (If the same person opens the project in two windows, it only counts as one user.)
How often are they using the app: Shows active user counts at different times over the selected time interval (default is three months).
Which user groups are using the app: Shows the breakdown of people using the app by the group they belong to. To learn more, see Groups.
How often are they using the app: Shows the breakdown of people using the app by the group they belong to over the selected time interval (default is three months). To learn more, see Groups.
Dashboards#
No. of Sessions: Total number of sessions across all users. A session is defined as a new dashboard opened. For example, If a user logs into a project they will land in the default dashboard, counting as 1 session. If they move to a new dashboard, the count rises to two.
Bounce Rate: Percentage of sessions where the user entered a dashboard but then took no action and closed the dashboard. For example, they did not perform a search, open an item or scroll the result list.
How many sessions happened: Total number of sessions over the selected time interval (default is three months).
Which dashboards are used the most: Shows the most frequently used dashboard within your filter criteria.
How often are they used: Shows the number of times each dashboard was opened over the selected time interval (default is three months).
Searches#
Note
Squirro Chat queries do not count toward search results. These stats reflect searches within all other Squirro dashboards.
No. of Searches: Total number of searches across all users.
Visit with Searches: Percentage of sessions where a search was performed.
How many searches where executed over time: Shows the number of searches performed over the selected time interval (default is three months).
Which strategies are used the most: Shows the most frequently used search strategy.
How often are they used: Shows the number of times each search strategy was used over the selected time interval (default is three months).
Trending Queries: Shows the most popular searches.
Items#
No. of Items Opened: Total number of items opened across all users.
In Document Search: Number of searches performed within documents in items view.
Visit with Item Views: Percentage of sessions where an item was opened.
How many items were opened: Shows number of opened items across all users over the selected time interval (default is three months).
Logs#
The logs shown in the Logs section relate only to activity-tracking. For data loading logs, see the Data Ingestion Logs Dashboard.
Data Ingestion Logs Dashboard#
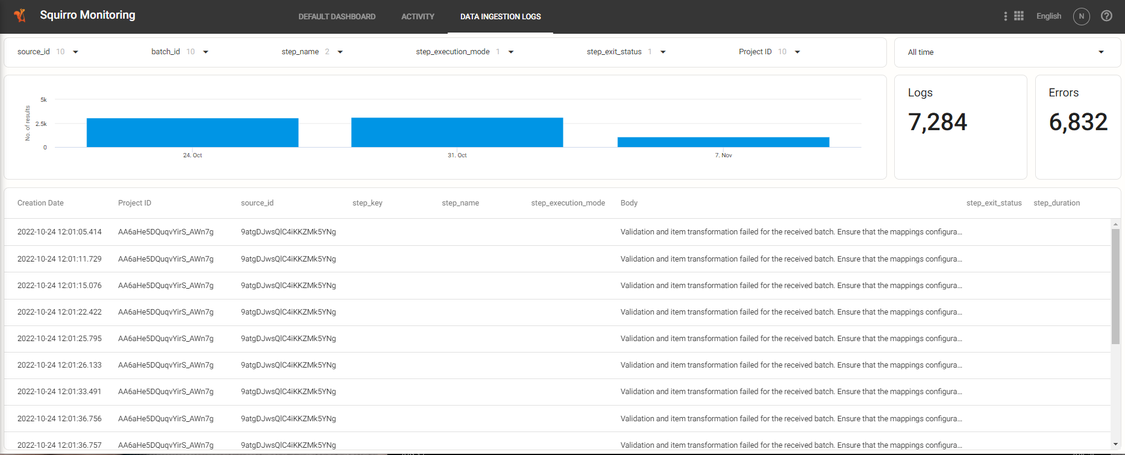
The Data Ingestion Logs dashboard displays data ingestion activity. On this dashboard, you can see if any errors occurred during the ingestion of data from the configured data sources into your Squirro instance. By default, the dashboard presents an activity chart and summary figures at top, with the most recent data ingestion logs below.
The following is an example Data Ingestion Dashboard:
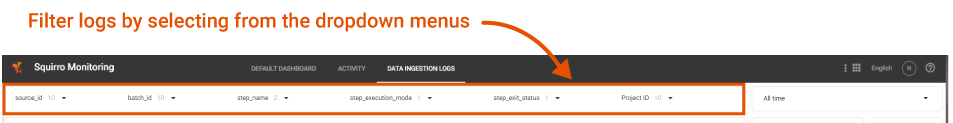
You can filter logs by selecting from the dropdown menus below the navigation bar as shown in the screen capture below:
By default, you can filter logs by the following parameters:
Project ID (
project_id): Display only the data ingestion logs related to the selected project.Source ID (
source_id): Display only the data ingestion logs related to the selected data source.Batch ID (
batch_id): Display only the data ingestion logs related to the selected batch (a batch is a set of items which belong to a specific data source and project).Pipeline Step Name (
step_name): Display only the data ingestion logs produced by a selected pipeline step. This can be a specific pipelet, ML model, or built-in step.Pipeline Step Execution Mode (
step_execution_mode): There are two execution modes for the pipeline steps: batch, parallel. With this filter you can see the data ingestion logs produced by the pipeline steps of a selected execution mode.Pipeline Step Exit Status (
step_exit_status): There are two exit statuses: error, success. With this filter you can see the data ingestion logs produced by the pipeline steps of a selected exit status.
Note
By default, only logs of INFO level and above are logged and displayed in the dashboard. If you would like to see all the emitted logs, then you would need to modify the log level of the Ingester service to DEBUG. This is not recommended for production instances as the amount of logs will be increased significantly, but it is helpful for development purposes.
Modifying the Squirro Monitoring Dashboards#
You can customize both the Activity and Data Ingestion Logs dashboards by following the steps below:
Click Setup from the Navigation menu.
Click Visualization from the top menu.
Hover over the dashboard you want to modify and click Edit.
Installing Squirro Monitoring#
Squirro Monitoring is a default part of every new project.
However, in releases prior to Squirro 3.6.8 LTS, Squirro Monitoring was not installed by default.
If your instance does not have Squirro Monitoring installed and you would like to add it, follow the instructions below:
Log in with your Squirro ID at start.squirro.com. If you do not have a Squirro ID, see the How to Register for a Squirro ID page.
Click My Instances in the upper-right corner of the page.
Select your instance.
Click your project title in the upper-left corner of the page.
Click the Plus icon to create a new project.
Select Squirro Monitoring from the list of available project templates.
Installation Limits#
Only one Squirro Monitoring project is allowed per instance.
If you try to create a new Squirro Monitoring project, but a monitoring project already exists, an error message displays informing you which project is the current monitoring project.
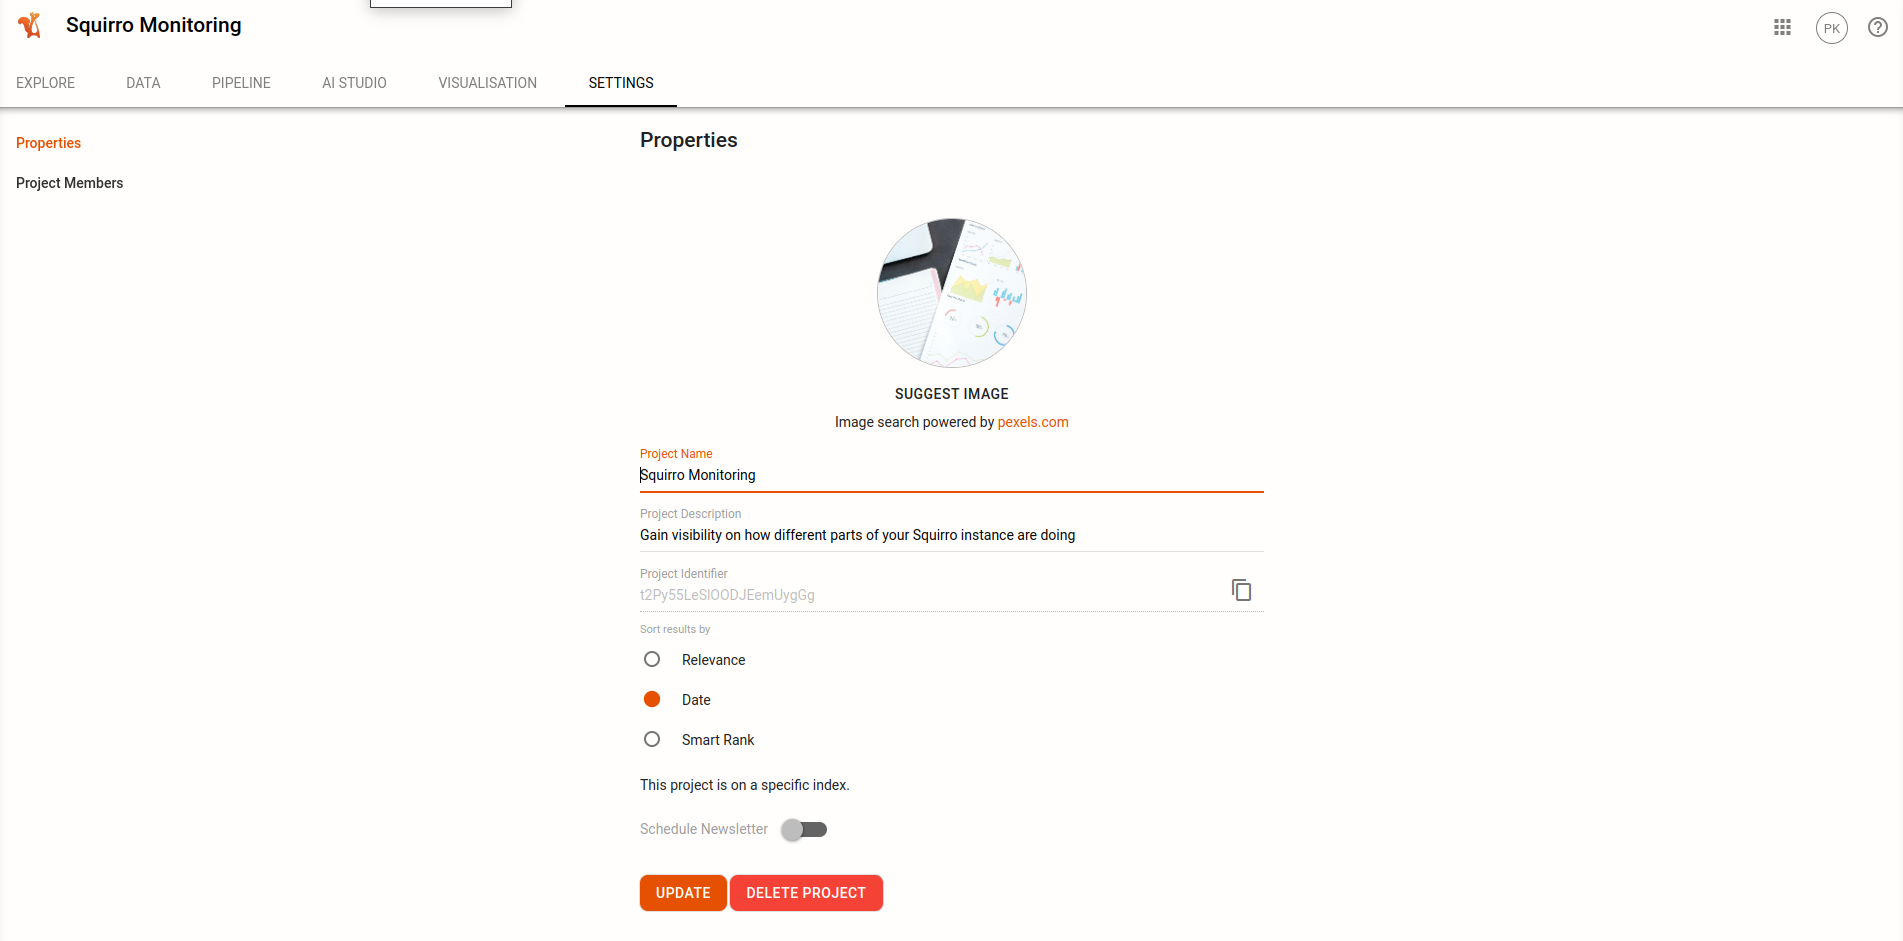
To install a new Squirro Monitoring project, you have to first delete the current one.
You can do this by opening the existing Squirro Monitoring project, then navigating to Setup → Settings → Properties and selecting Delete Project.